


The income statement vs balance sheet comparison becomes simple once you focus on time. One report measures business performance across a period. The other shows financial position on one specific date.
Direct answer: A profit-and-loss report shows revenue, expenses, and profit over a period. A balance sheet shows assets, liabilities, and equity at one point in time. Business owners should review both because profitability alone cannot show debt, liquidity, or the resources available to the company.
| Key point | Profit-and-loss report | Balance sheet |
|---|---|---|
| Main purpose | Measures profitability | Shows financial position |
| Time covered | A month, quarter, or year | One specific date |
| Main accounts | Revenue and expenses | Assets, liabilities, and equity |
| Main result | Net income or net loss | Net assets and owner equity |
| Best question answered | Did the business make money? | What does the business own and owe? |
| Useful for | Margins, pricing, cost control | Liquidity, debt, working capital |
| Connection | Profit affects equity | Equity reflects accumulated results |
Key Takeaways
- A profit-and-loss report measures financial performance across time.
- A balance sheet provides a financial snapshot on one date.
- Revenue and expenses belong to the performance report.
- Assets, liabilities, and equity appear on the financial-position report.
- Net income can increase retained earnings or owner equity.
- A profitable company can still have weak liquidity or heavy debt.
- Owners get a clearer picture by reviewing both reports with cash flow.
What is an Income Statement vs. Balance Sheet
This report explains whether a company generated a profit during a defined period. It starts with revenue and subtracts business costs and expenses. The final result is usually net income or net loss.
Common sections include revenue, cost of goods sold, operating expenses, and taxes. Some companies also separate interest and non-operating gains or losses. The exact presentation depends on the company and its reporting needs.
The basic relationship is straightforward:
Revenue − Expenses = Net Income or Net Loss
The U.S. Securities and Exchange Commission’s beginners’ guide to financial statements describes this report as a measure of financial performance over a specific period. It also identifies revenue, expenses, and net income as its central components.
A business owner can use these numbers to assess pricing and expense control. Comparing several periods can reveal changes in margins or operating costs. Those patterns often matter more than one isolated month.
What a Balance Sheet Shows
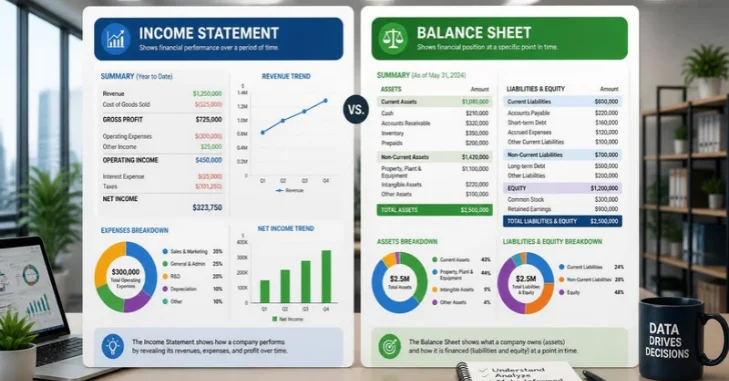
An Income Statement vs. Balance Sheet answers a different financial question. It shows what the company owns and owes on a particular date. It also reports the owners’ remaining financial interest.
The three main categories are assets, liabilities, and equity. Assets can include cash, receivables, inventory, equipment, or property. Liabilities can include bills, loans, taxes payable, and other obligations.
Its central accounting equation is:
Assets = Liabilities + Equity
The SEC explains that assets must equal liabilities plus shareholders’ equity. This relationship keeps the report mathematically balanced. It also helps readers understand how business resources were financed.
This statement can reveal risks that profitability figures cannot show alone. Heavy short-term debt can create pressure despite good earnings. Low working capital can create similar problems.
Income Statement vs Balance Sheet: 7 Key Differences
Understanding the differences helps owners choose the right report for each decision. The two statements overlap through accounting relationships, but they serve distinct purposes. Neither should replace the other.
| Difference | Profit-and-loss report | Balance sheet |
|---|---|---|
| 1. Time | Covers a reporting period | Covers one date |
| 2. Main purpose | Measures performance | Measures financial position |
| 3. Accounts | Revenue and expenses | Assets, liabilities, equity |
| 4. Main result | Profit or loss | Financial resources and obligations |
| 5. Account treatment | Period accounts reset | Many balances carry forward |
| 6. Management use | Pricing and cost decisions | Liquidity and financing decisions |
| 7. Main question | Are operations profitable? | Is the company financially positioned well? |
1. They Measure Different Time Frames
Performance must be measured between a beginning and ending date. A monthly report might cover January 1 through January 31. An annual version could cover the full fiscal year.
The financial-position report works differently. It describes account balances on one specific date. December 31 figures therefore represent that date rather than the entire year.
2. They Contain Different Types of Accounts
Sales and operating expenses belong to the performance side of financial reporting. Rent, payroll expense, advertising, and similar costs affect reported earnings. These accounts help explain how profit was produced.
Assets and debts appear on the financial-position side. Cash, accounts receivable, inventory, loans, and accounts payable are common examples. Owner or shareholder equity completes the equation.
3. They Answer Different Management Questions
Owners often review profitability when deciding whether prices cover operating costs. Falling margins can signal rising costs or weak pricing. Expense trends can also reveal areas needing closer control.
The financial position report supports different decisions. It can show whether short-term resources appear sufficient for upcoming obligations. It can also reveal growing debt or receivable balances.
4. Their Accounts Behave Differently Between Periods
Revenue and expense accounts normally relate to a specific accounting period. The next reporting period begins measuring new activity. Prior results remain preserved through equity and historical reporting.
Many asset and liability balances continue into the next period. An unpaid customer invoice does not disappear when the month ends. Neither does a loan balance or unpaid supplier bill.
5. Profit Connects the Two Reports
The statements are separate, but their numbers are connected. Net income generally increases retained earnings or owner equity, subject to distributions and other adjustments. A net loss generally reduces accumulated equity.
AccountingCoach illustrates this connection using revenue earned before a customer pays. Revenue increases earnings while accounts receivable increases assets. The transaction therefore affects both performance and financial position.
6. Neither Report Shows the Full Cash Story
Reported profit and available cash can move differently. Credit sales may increase revenue before customers send payment. Equipment purchases can reduce cash without becoming a full current-period expense.
That distinction makes the statement of cash flows useful. Business Strategy’s cash flow statement guide explains operating, investing, and financing cash movements. Reading all three reports gives owners stronger context.
7. Different Decisions Require Different Starting Points
Start with profitability when you are reviewing sales, margins, and operating costs. Start with financial position when debt, working capital, or liquidity matters most. Then check the other report before making a major decision.
This habit matters during acquisitions as well. Business Strategy’s guide to buying a business recommends reviewing profit-and-loss statements and balance sheets during financial due diligence. Buyers need both earnings quality and financial obligations to assess a company properly.
A Simple Example of How Both Statements Work Together
Consider a U.S. consulting company that invoices customers during one month. It earns $50,000 in revenue and records $35,000 of expenses. This produces $15,000 in accounting profit.
Suppose customers have paid only $30,000 by month-end. The remaining $20,000 sits in accounts receivable. Profit therefore does not equal the cash collected.
The company could also owe $12,000 on a business loan. That debt appears with its other obligations. The profitability report alone would not tell the owner about that loan balance.
| Example item | Amount | Where it mainly appears |
|---|---|---|
| Revenue | $50,000 | Performance report |
| Expenses | $35,000 | Performance report |
| Net income | $15,000 | Performance report and equity connection |
| Accounts receivable | $20,000 | Balance sheet |
| Business loan | $12,000 | Balance sheet |
This example shows why reviewing one report can create an incomplete impression. The business earned money, but some revenue remains uncollected. It also carries debt that affects its financial position.
Which Statement Should a Small Business Review First?
There is no universal first choice for every decision. Start with the report that answers the question you are asking. Then use the second report to test whether the first conclusion holds.
For monthly management, many owners begin with revenue, costs, and profit. They can then check cash, receivables, payables, and debt balances. This sequence connects operating performance with financial capacity.
Administrative systems also affect reporting quality. Inconsistent bookkeeping creates unreliable reports regardless of their format. Business Strategy’s guide to scaling small-business administrative functions discusses accounting support as businesses grow.
Common Mistakes Business Owners Make
Looking only at profit is one common mistake. Strong earnings do not guarantee enough cash for payroll or suppliers. Outstanding invoices can delay the money needed for daily operations.
Another mistake is treating every liability as a warning sign. Debt can finance equipment, inventory, or expansion. The key question is whether repayment obligations fit the company’s resources and cash generation.
Owners should also avoid comparing unmatched dates or periods. A yearly performance report should not be casually compared with an unrelated midyear financial snapshot. Matching dates creates a clearer financial story.
How Lenders and Investors Use Both Reports
Lenders can study profitability to judge whether operations generate earnings. They can also examine debt, liquidity, and existing obligations. One report provides performance history while the other shows financial position.
Investors often apply the same broad logic. Consistent profits can be attractive, but weak finances may increase risk. Strong assets also mean little if operations continually lose money.
A business preparing for outside financing should keep both reports current. Clean records can make financial questions easier to answer. They can also reduce confusion during due diligence.
How the Cash Flow Statement Completes the Picture
The third core report explains actual cash movement. It separates operating, investing, and financing activities. Those categories help explain why the cash balance changed.
This matters because accrual accounting includes timing differences. Revenue may be recorded before collection occurs. Expenses can also be recognized before or after related cash payments.
QuickBooks similarly notes that the three statements answer separate but connected questions. Its guidance explains that changes in one statement can affect the others.
Use Both Reports for Better Financial Decisions
No single financial statement explains every part of a business. Profitability shows whether operations produced earnings during a period. Financial position shows what remained in assets, debt, and owner equity.
Review the reports together before borrowing, hiring, expanding, or making large purchases. Add cash flow when timing and liquidity matter. That three-report view gives you a stronger basis for business decisions.
Frequently Asked Questions
What is the main income statement vs balance sheet difference?
The biggest difference is the measurement period. The first report shows revenue, expenses, and profit across time. The second shows assets, liabilities, and equity on one date.
Is a profit-and-loss statement the same as an income statement?
Yes, the terms generally describe the same financial report. Both show revenue, expenses, and resulting profit or loss. Businesses may use either name in their accounting software.
Does net income appear on the balance sheet?
Net income affects equity through retained earnings or the owner’s capital accounts. The exact presentation depends on the business structure and reporting format. Profits retained in the company generally increase accumulated equity.
Which statement shows cash?
Cash appears as an asset on the balance sheet. That number shows the amount available on the reporting date. The cash flow statement explains why that balance changed during the period.
Can a profitable business have a weak balance sheet?
Yes, that situation is possible. A company can earn profits while carrying heavy debt or weak liquidity. It may also have large receivables that have not yet become cash.
How often should a small business review these reports?
Monthly reviews work well for many operating businesses. Quarterly comparisons can reveal broader trends. Annual statements remain important for taxes, lenders, owners, and long-term analysis.